Have you ever used a fishbone diagram to identify the root cause of a problem? Whether you’re managing a project, leading a team, or looking to improve a process, a fishbone diagram—also known as a cause-and-effect diagram or Ishikawa diagram—can help you analyze and visualize the factors contributing to an issue and guide you toward effective solutions.
Table of Contents
What is a Fishbone Diagram?
A fishbone diagram is a visual tool used to identify the potential root causes of a specific problem or effect. It gets its name from its appearance, which resembles the skeleton of a fish, with the problem impact being the “head” and the potential causes branching off like the “bones.”
The fishbone diagram, also known as the Ishikawa diagram, was developed by Kaoru Ishikawa, a Japanese quality control expert. Ishikawa created this tool in the 1960s as a way to help organizations identify and analyze the root causes of quality issues. Since then, the fishbone diagram has become a widely used tool in various industries for problem-solving and process improvement.
This diagram helps teams brainstorm and organize potential causes, leading to a better understanding of the problem and more effective solutions.
Why Do You Need Cause and Effect Charts?
There are several reasons why a fishbone diagram is a valuable tool for problem-solving and decision-making processes. Some of the key benefits include:
- Structured Analysis: The diagram provides a structured framework for organizing and analyzing potential causes.
- Team Collaboration: It encourages team members to collaborate and contribute their insights and perspectives.
- Visual Clarity: The diagram’s visual nature makes it easy to understand and communicate complex relationships.
- Root Cause Identification: By systematically analyzing potential causes, teams can more effectively identify the root cause of a problem.
Pros and Cons of a Fishbone Diagram
Like any tool, fishbone diagrams have their advantages and limitations. Understanding the pros and cons can help you make the most of this technique in problem-solving processes.
1. Pros
Some of the key benefits of using fishbone diagrams include:
- Visual Representation: The diagram’s visual nature makes it easy to understand and communicate complex relationships.
- Structured Analysis: The structured approach helps teams systematically identify and analyze potential causes.
- Collaborative Tool: Fishbone diagrams encourage team collaboration and collective problem-solving.
- Root Cause Identification: By visually mapping potential causes, teams can more effectively identify the root cause of a problem.
- Effective Problem-Solving: The systematic approach of fishbone diagrams leads to more targeted and sustainable solutions.
- Data-Driven Decisions: Fishbone diagrams enable organizations to make informed decisions based on evidence and analysis.
2. Cons
However, there are some limitations to consider when using fishbone diagrams:
- Subjectivity: The analysis relies on team members’ perceptions and assumptions, which may introduce bias.
- Complexity: In complex situations, the diagram may become overwhelming with numerous potential causes.
- Time-Consuming: Generating a comprehensive fishbone diagram can be time-consuming, especially in large teams or projects.
- Overlooking Factors: There is a risk of overlooking important factors or causes if not all perspectives are considered during the analysis.
- Limited Scope: Fishbone diagrams may not capture all interdependencies or systemic issues that contribute to a problem.
When Should a Fishbone Diagram Be Used?
A fishbone diagram is most effective when used in situations where the root cause of a problem is not immediately apparent. It can be used in various scenarios, including quality improvement projects, process analysis, troubleshooting, and risk management.
By using a fishbone diagram, teams can systematically analyze the factors contributing to a problem and develop targeted solutions.
How to Make a Cause and Effect Diagram
Creating a fishbone diagram involves several steps to ensure a comprehensive analysis of the problem. Here are the key steps to follow:
1. Define the Problem
The first step in creating a fishbone diagram is to clearly define the problem or effect that you are trying to address.
This initial step sets the stage for the rest of the analysis and helps focus efforts on identifying the root causes rather than symptoms.
2. Identify Major Categories
Once the problem is defined, the next step is to identify the major categories of potential causes related to the problem. These categories typically include factors such as people, processes, equipment, materials, and environment.
By categorizing potential causes, teams can organize their analysis more effectively.
3. Brainstorm Causes
With the major categories identified, teams can then engage in a brainstorming session to generate potential causes within each category.
It is essential to encourage creativity and open communication during this phase to ensure that all possible causes are considered, even those that may seem unlikely at first glance.
4. Create The Diagram
Using the major categories and subcategories of causes identified during the brainstorming session, teams can now create the fishbone diagram.
The diagram typically consists of a horizontal line representing the problem or effect and diagonal lines branching off from it to represent the major categories and subcategories of causes.
5. Analyze and Prioritize Causes
Once the fishbone diagram is complete, teams can analyze the potential causes and prioritize those that are most likely to contribute to the problem.
This analysis may involve further investigation, data collection, or validation to determine the significance of each cause of the overall issue.
6. Develop Solutions
Based on the analysis of potential causes, teams can then develop targeted solutions to address the root causes of the problem.
These solutions should be specific, actionable, and aimed at eliminating or mitigating the identified causes to prevent the problem from recurring in the future.
7. Implement and Monitor Solutions
After developing the solutions, it is crucial to implement them effectively and monitor their impact on addressing the root causes.
Teams should track the progress of the solutions, gather feedback, and make adjustments as needed to ensure that the problem is effectively resolved and that the solutions are sustainable in the long term.
8. Continuous Improvement
Using a fishbone diagram for problem-solving is not a one-time activity but rather an ongoing process of continuous improvement.
Organizations should incorporate the lessons learned from each problem-solving effort into their processes, systems, and decision-making to enhance overall performance and prevent similar issues from arising in the future.
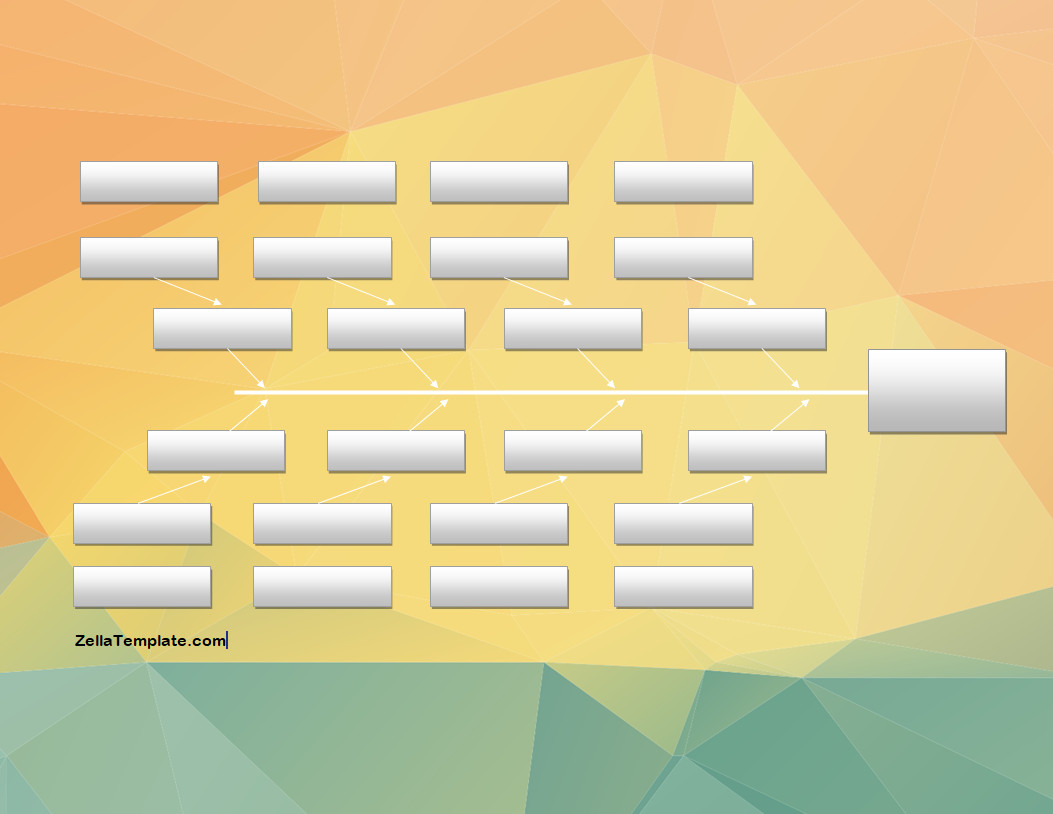
Fishbone Diagram Template
Whether you’re tackling quality issues, brainstorming solutions, or analyzing processes, a structured fishbone diagram template makes the process more efficient and focused.
Use our free Fishbone Diagram template today to streamline your problem-solving and analysis. Fully editable and easy to use—ideal for business teams, educators, project managers, and students alike.